InfiPLANNER: Link Planning Tool
"Point-to-Multipoint" Links
account course progress
The toolbar in PtMP mode includes 3 sections:
- Base station parameters.
- Base station sectors parameters.
- Subscriber terminals parameters.
However, unlike in the PtP mode, the toolbar has a hierarchical structure due to the fact that each base station has many sectors and each sector has many connected subscriber terminals. Thus, if you go to the toolbar to configure the base station, you will find the list of its sectors. After selecting a sector, its parameters and list of subscriber terminals will be available.
PtMP planning
The PtMP mode is similar to the PtP mode, but has a number of features:
- Only the geo-located mode is available.
- The configuration of the Base station sectors is performed first of all. Then the subscriber terminals are added and the connection with a particular sector is established.
- Access to the various interface functions is performed via the context menu of the point on the map.
Base station
Each base station (BS) is an aggregation of sectors. Each BS can include up to 6 sectors.
The base station's coordinates can be determined on the map by pressing the left mouse button in the proposed location and by selecting "Add base station" in the context menu or by pressing "2".
Note
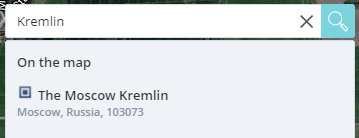
There is also possible to search the area on the map by city name, street name, company name, house number, etc. In order to do this, use the search form located at the top of the working space.
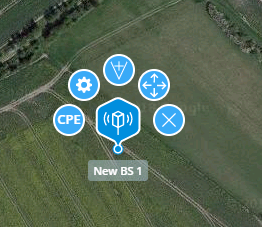
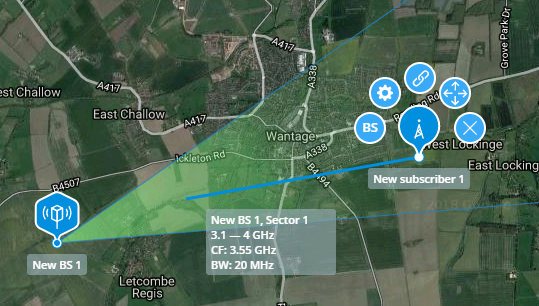
The subsequent control of the point is performed through the special context menu available via click on the appropriate object. The menu includes the following functions (from left to right as illustrated in the picture below):
- The conversion from BS to CPE.
- Proceeding to the toolbar for further base station parameter configuration.
- New base station sector creation.
- BS repositioning on the map.
- BS deletion.
Sectors should be created for each base station. Each sector should be oriented using the azimuth and elevation angles. In order to add a new sector, press the corresponding button in the BS context menu. Each sector is represented on the map by the radiation pattern with an angle equal to the antenna's radiation angle.
Note
The sector's antenna radiation pattern is represented schematically. The main lobe's maximum level is also schematic and does not determine the sector's real energy potential. Thus, the directional diagram drawn on the map is intended for the visual representation of the antenna's radiation direction only.
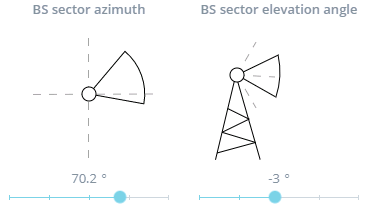
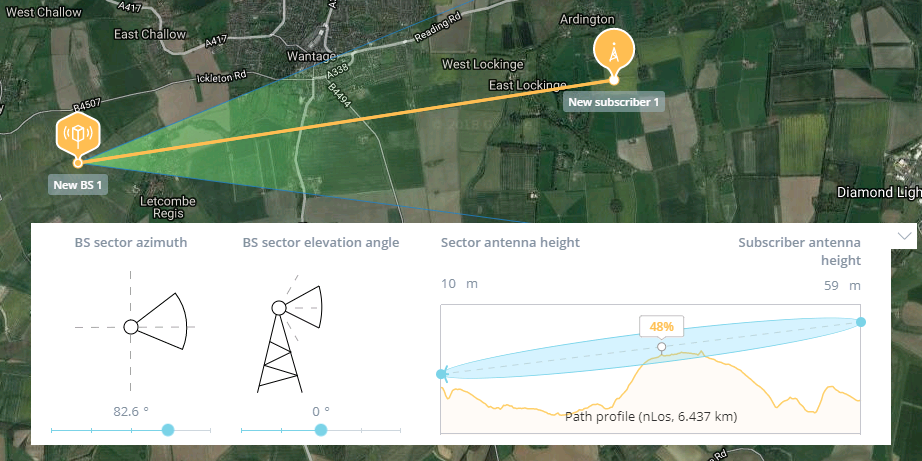
Once the sector has been added, it is necessary to clarify its orientation by specifying the azimuth and the elevation angles.
- The azimuth can be changed directly on the map - it is necessary to capture the sector with the mouse and move it to the desired position. However, the map does not have the ability to orient based on the elevation angle.
- For a more accurate orientation you must select the appropriate BS and sector in the toolbar. After that, a schematic diagram with the azimuth and the elevation angles will appear at the bottom of the working space. Here you can set the angles with an accuracy of up to 0.1 degree.
The wireless link parameters, the device model and the antenna height must be defined for each sector. These can be done from the sector's settings toolbar and are similar to the link setting in the PtP mode.
Subscriber terminal
The subscriber's terminal coordinates are also determined by pressing the left mouse button in the proposed location on the map and by selecting "Add subscriber" in the context menu or by pressing "1".
Note
In case that the subscriber terminal is placed on the map in the area of the sector's antenna radiation pattern, its addition is performed using the right mouse button. However, as mentioned above, the radiation pattern is schematic, the actual coverage is much larger.
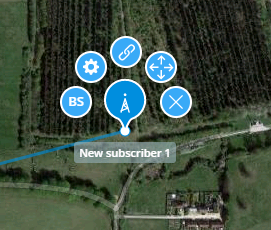
The subscriber's terminal management is similar to the BS and is performed through the context menu having the following functions:
- Conversion from CPE to BS.
- Proceeding to the toolbar for further subscriber terminal parameter configuration.
- Creation of the wireless link with the BS sector.
- CPE repositioning on the map.
- CPE deletion.
The wireless link creation is performed manually, regardless of which sector the subscriber terminal is in. In the context menu, select the connection creation function, then move the mouse cursor to the BS sector's coverage area and click the left button - the connection will be created. You can also move the cursor directly to the BS, in which case the CPE will be connected to the sector in which it is visible.
The subscriber's terminal configuration can be performed after the connection has been created. In the PtMP mode the CPE characteristics are inherited from the connected BS sector, so you only have to select the device model and the antenna height.
The interference signal level must be set according to the results found during the scan in the area where the subscriber terminal is located. The scan can be performed as described for the base station sector configuration in the section above.
The path profile is also available at the bottom of the working space.
The color of the connecting line between the CPE and the BS sector displays the overlapping of the first Fresnel zone:
- Green - 0-40%.
- Yellow - 40-60%.
- Red - 60-100%.
Note
The overlapping is not determined automatically, therefore, the connection line will be colored only when the connection is selected.
Note
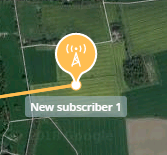
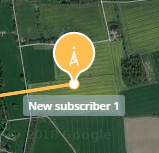
The mast pictogram is displayed for each CPE point. If it is displayed without radio signals, it means that the CPE configuration is not completed. If the radio signal is present, then the CPEs are configured and you can review the estimation results.
Estimation results
All BS connections
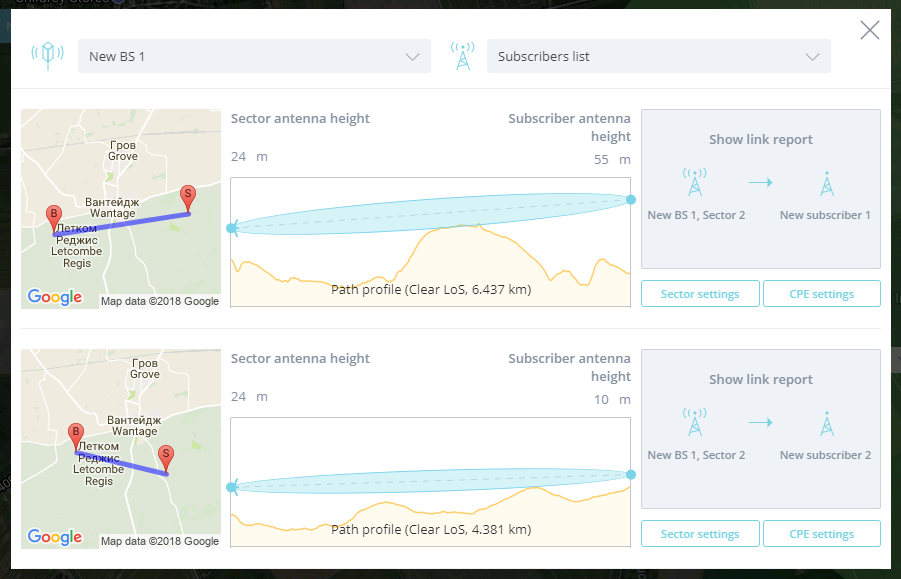
All base station's wireless links and specific BS sector views are available in the PtMP mode. Unlike viewing links on the map, here you can see them in a list with the following information:
- BS and CPE coordinates.
- Path profile.
- Proceeding to link settings and estimation results.
In order to go to this view use the "All links" button above the toolbar.
How to read the estimation results
In order to go to the estimation results use the "Result" button above the toolbar.
The results are presented in summary and detail forms, similar to the PtP mode. The summary report allows you to make an overall estimation of the planned link. It includes the following information:
- Link parameters and device models for each point.
- Modulation scheme and link characteristics for maximum availability.
- Modulation scheme and link characteristics for maximum throughput.
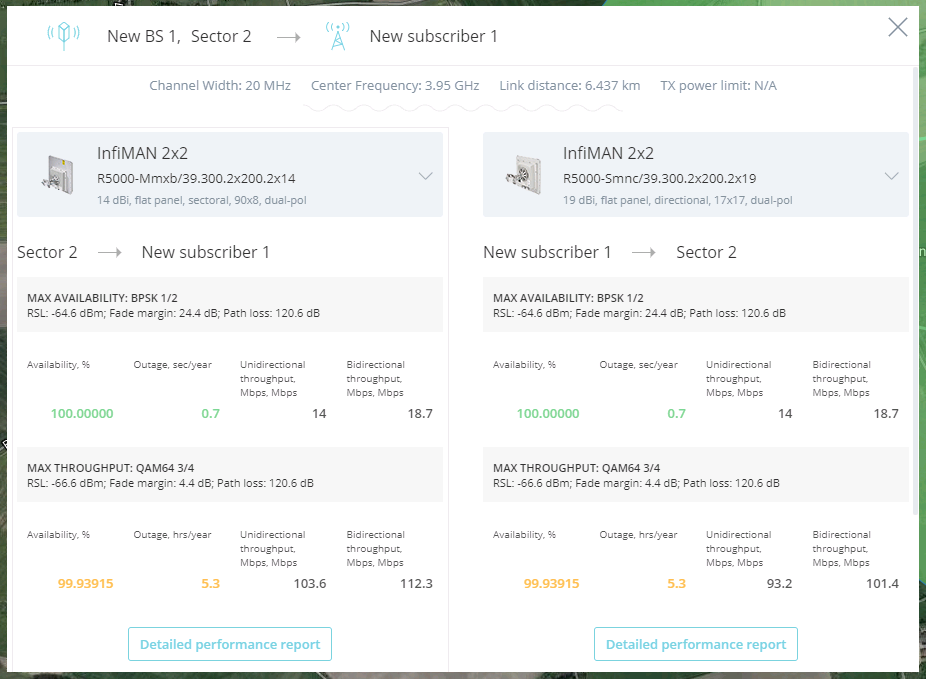
Note
The estimation of the characteristics for the "Sector BS - CPE" link is performed without taking into account the sector's connection with other subscribers. So, the maximum throughput is estimated for the situation when the sector connection with the CPE is the only one.
In order to obtain a detailed report please click on "Detailed performance report".