Quanta 5 / Quanta 6: Installation and Configuration
Diagnostics
account course progress
Quanta 5 / Quanta 6 diagnostic tools area: a dashboard, a system log, in some cases, the Alignment and Spectrum analyzer utilities. More detailed information about these tools you can find in Mounting and Antenna alignment.
Dashboard
This section is intended to provide the main information about the wireless unit operation.
The Dashboard displays a read-only summary of the current link status information, local and remote device signal strength, capacity for downlink and uplink, current values of the basic configuration settings and Ethernet network status.
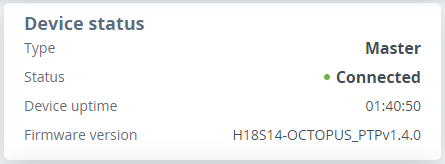
Device status
This part of the "Status" tab contains the device type: Master or Slave, the wireless connection state, the device uptime since the last reboot, and the software version loaded.
Wired interface
In the "Wired interface" tab, the wired interface status can be monitored, as well as media type, duplex mode and traffic load for reception and transmission. The wired interface statistic is available on the right side, it can be reset by the "Clear counters" button.
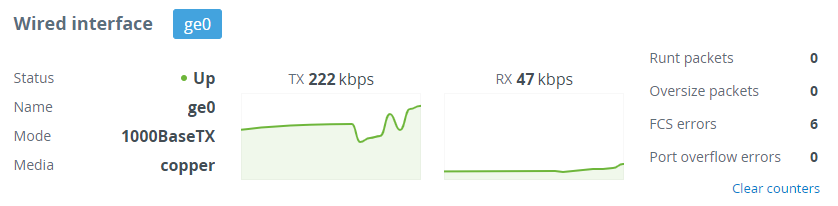
| Runt packets | Packets less than 64 bytes in size |
| Oversize packets | Packets larger than 9038 bytes |
| FCS errors | Packets dropped due to checksum mismatch. The possible reasons for the error counter increasement are described in the "Troubleshooting" article |
| Port overflow errors | Packets dropped due to port buffer overflow |
Wireless link status
The “Radio” tab displays the current settings of the wireless connection, as well as the link load in the uplink and downlink directions.
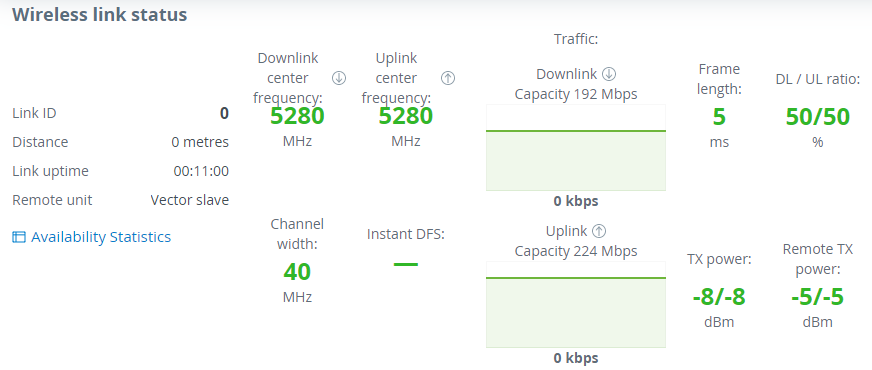
| Link ID | Wireless link can be established only with devices which have the same link ID. |
| Distance | The estimated link length. |
| Link uptime | The link operating time since the last outage. |
| Remote unit | The remote device name. |
| Center frequency | The downlink and uplink center frequency value set in the "Radio" section manually or by the automatic frequency selection mechanism. |
| Channel width | The channel width value set in the "Radio". |
| Instant DFS | Instant DFS option state (only for Quanta 5 family devices). |
| Traffic | The wireless link capacity and utilization in the uplink and downlink directions. |
| Frame size | The frame size value set in the "Radio". |
| DL / UL ratio | The ratio of the downlink traffic to uplink, set in the "Radio" section manually or by a mechanism for automatically determining the optimal ratio. |
| Tx power | The transmitter power value on the local device determined by the automatic power control mechanism for each polarization. If the automatic transmit power control tool is disabled, the value set manually by the user will be displayed. |
| Remote X power | The transmitter power value on the remote device determined by the automatic power control mechanism for each polarization. If the automatic transmit power control tool is disabled, the value set manually by the user will be displayed. |
Availability statistics
The link availability statistics window displays the following information:
- The overall wireless link availability since the last device reboot, the number of wireless outages when the connection was unavailable.
- Availability statistics for each modulation, for both polarization for downlink and uplink streams.
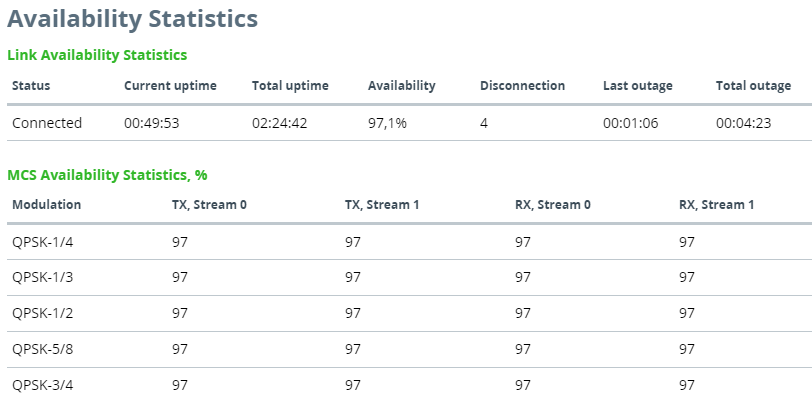
Modulation and Coding Scheme
On Quanta 5 / Quanta 6 devices modulation and coding schemes are selected independently for each channel (uplink and downlink) for both polarizations. Current modulation for each channel is displayed in the MCS subsection.

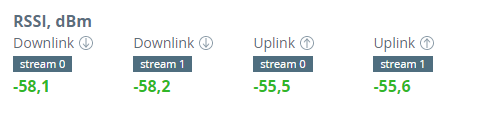
Received Signal Strength Indicator
The RSSI indicator displays the received signal level for each channel (uplink and downlink) and both polarizations. Available values:
- -90...-80 dBm - close to the receiver sensitivity level, only the lowest modulations are available.
- -80...-60 dBm - average input range.
- -60...-40 dBm - the recommended range for achieving best performance.
- >-40 dBm - input signal level is too high.
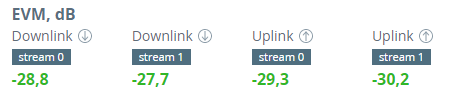
EVM
Error vector magnitude - indicator of the measured input signal quality, telling how far are the received constellation symbols compared to the ideal symbols of the constellation. The parameter value must be as high as possible in absolute value. The recommended level should be more than 21 dB in absolute value.
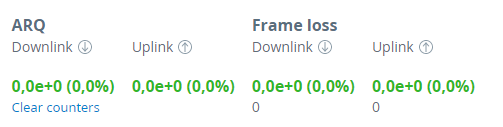
Retries and Frame loss
Retried and lost packets need also to be tracked. Retries should tend to zero, link with the retries value more than 5% should not be allowed to operation.
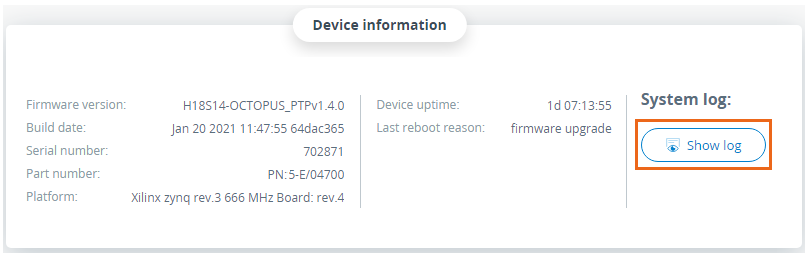
System Log
An important tool in troubleshooting, which allows to track changes that preceded the link degradation. To view the system log, go to "Service" → "Maintenance" → "Device information" and click the "Show log" button.